02/05: custom function series using wpf charting toolkit
the wpf build of the silverlight charting toolkit has recently been released:
Delay's Blog
using jafar husain's excellent tutorial on creating a custom chart series:
Writing Your Own Silverlight Chart Series (Part 1): Making Designers Happy
and
Writing Your Own Silverlight Chart Series (Part 2): Implementing the Series
i was able to create a function series in f#:
#light
namespace Charts
open System
open System.Windows
open System.Windows.Media
open System.Windows.Markup
open System.Windows.Shapes
open System.Windows.Controls
open System.Windows.Controls.DataVisualization
open System.Windows.Controls.DataVisualization.Charting
module Seq =
let of_type<'a> (s : System.Collections.IEnumerable) =
seq {
for item in s do
match item with
| :? 'a as item -> yield item
| _ -> ()
}
let range (s : 'a seq) =
if Seq.isEmpty s then None else
s |> Seq.fold
(fun (min, max) a ->
let max = if a > max then a else max
let min = if a < min then a else min
(min, max)
) (Seq.hd s, Seq.hd s) |> Some
let (|Range|_|) (range : 'a Range) =
if range.HasData then Range (range.Minimum, range.Maximum) |> Some else None
type public FunctionSeries(?fx : float -> float) as this =
inherit Series()
[<DefaultValue>]
static val mutable public PointsProperty : DependencyProperty
static do FunctionSeries.PointsProperty <- DependencyProperty.Register("Points", typeof<PointCollection>, typeof<FunctionSeries>)
let mutable itemSource : System.Collections.IEnumerable = null
let mutable plotArea : Canvas = null
let mutable (xaxis : IAxis), (yaxis : IRangeAxis) = null, null
let mutable range = Range(-1.0, 1.0)
let mutable f = fun x -> x
let calculateItems () =
let detail = 600.0
match range with
| Seq.Range (min, max) ->
[0.0..detail]
|> List.map (fun x -> x * ((max - min) / detail) + min)
|> Seq.map (fun x -> Point(x, f x))
| _ -> Seq.empty
do
match fx with | Some fx -> f <- fx | None -> ()
itemSource <- calculateItems()
do
use stream = (Application.GetResourceStream(Uri("FunctionSeries.xaml", UriKind.RelativeOrAbsolute))).Stream
this.Style <- (XamlReader.Load(stream) :?> Style)
override this.Refresh() =
if xaxis <> null && yaxis <> null then
this.Points <-
itemSource |> Seq.of_type<Point>
|> Seq.map
(fun p ->
let x = xaxis.GetPlotAreaCoordinate(p.X).Value.Value
let y = this.ActualHeight - yaxis.GetPlotAreaCoordinate(p.Y).Value.Value
Point(x, y))
|> Seq.sortBy (fun p -> p.X)
|> (fun s -> PointCollection s)
else ()
override this.OnApplyTemplate() =
plotArea <- (this.GetTemplateChild("canvas") :?> Canvas)
this.Refresh()
override this.OnSeriesHostPropertyChanged(o, n) =
let points = itemSource |> Seq.of_type<Point>
if n <> null && Seq.isEmpty points |> not then
let first = Seq.nth 0 points
xaxis <- n.Axes
|> Seq.filter (fun a -> a.CanPlot(first.X) && a.Orientation = AxisOrientation.X)
|> Seq.nth 0
yaxis <- n.Axes
|> Seq.of_type<IRangeAxis>
|> Seq.filter (fun a -> a.CanPlot(first.Y) && a.Orientation = AxisOrientation.Y)
|> Seq.nth 0
xaxis.RegisteredListeners.Add(this)
yaxis.RegisteredListeners.Add(this)
do this.SizeChanged.Add(fun e -> this.Refresh())
member this.Range
with set value =
range <- value
itemSource <- calculateItems()
and get () = range
member this.Function
with set value =
f <- value
itemSource <- calculateItems()
and get () = f
member this.Points
with get () = this.GetValue(FunctionSeries.PointsProperty) :?> PointCollection
and set (value : PointCollection) = this.SetValue(FunctionSeries.PointsProperty, value)
interface IAxisListener with
member this.AxisInvalidated(a) = this.Refresh()
interface IRangeProvider with
member this.GetRange(consumer : IRangeConsumer ) =
if obj.ReferenceEquals(consumer, xaxis) then
let range =
itemSource
|> Seq.cast<Point>
|> Seq.map (fun p -> p.X)
|> Seq.range
match range with
| Some (min, max) -> Range<IComparable>(min, max)
| None -> Range()
else if obj.ReferenceEquals(consumer, yaxis) then
let range =
itemSource
|> Seq.cast<Point>
|> Seq.map (fun p -> p.Y)
|> Seq.range
match range with
| Some (min, max) -> Range<IComparable>(min, max)
| None -> Range()
else Range<IComparable>()
[<STAThread>]
do
let window = Window()
let app = Application()
let chart = Chart()
//parabola:
let functionSeries = FunctionSeries(fun x -> x * x)
//sine wave:
functionSeries.Function <- fun x -> Math.Sin x
functionSeries.Range <- Range(-10.0, 10.0)
//square wave:
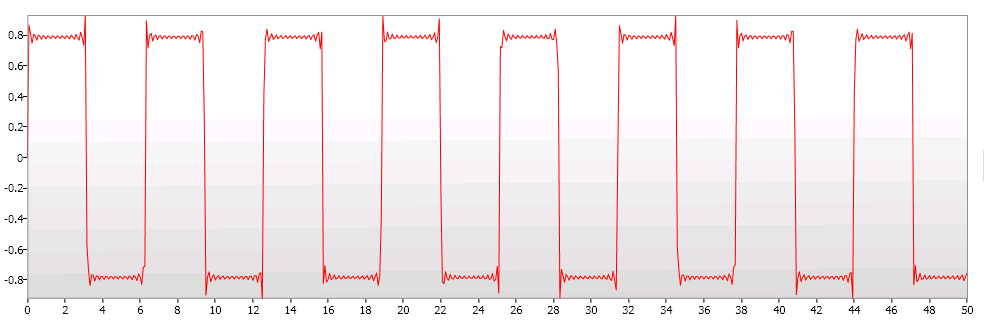
functionSeries.Range <- Range(0.0, 50.0)
functionSeries.Function <- fun x -> [3.0..2.0..49.0] |> List.fold (fun a b -> a + Math.Sin(b * x) / b) (Math.Sin x)
window.Width <- 1050.0; window.Height <- 400.0
chart.Axes.Add(LinearAxis(Orientation = AxisOrientation.X))
chart.Axes.Add(LinearAxis(Orientation = AxisOrientation.Y))
chart.Series.Add functionSeries
window.Content <- chart
app.Run(window) |> ignore
you will also require this xaml file:
<Style
xmlns="http://schemas.microsoft.com/winfx/2006/xaml/presentation"
xmlns:x="http://schemas.microsoft.com/winfx/2006/xaml"
xmlns:local="clr-namespace:Charts;assembly=achart"
TargetType="local:FunctionSeries">
<Setter Property="Template">
<Setter.Value>
<ControlTemplate TargetType="local:FunctionSeries">
<Canvas x:Name="canvas">
<Polyline Points="{TemplateBinding Points}" Stroke="Red" StrokeThickness="1" StrokeMiterLimit="1" />
</Canvas>
</ControlTemplate>
</Setter.Value>
</Setter>
</Style>
note that you will have to replace "assembly=achart" in the xaml file with the name of your project/assembly.
Delay's Blog
using jafar husain's excellent tutorial on creating a custom chart series:
Writing Your Own Silverlight Chart Series (Part 1): Making Designers Happy
and
Writing Your Own Silverlight Chart Series (Part 2): Implementing the Series
i was able to create a function series in f#:
#light
namespace Charts
open System
open System.Windows
open System.Windows.Media
open System.Windows.Markup
open System.Windows.Shapes
open System.Windows.Controls
open System.Windows.Controls.DataVisualization
open System.Windows.Controls.DataVisualization.Charting
module Seq =
let of_type<'a> (s : System.Collections.IEnumerable) =
seq {
for item in s do
match item with
| :? 'a as item -> yield item
| _ -> ()
}
let range (s : 'a seq) =
if Seq.isEmpty s then None else
s |> Seq.fold
(fun (min, max) a ->
let max = if a > max then a else max
let min = if a < min then a else min
(min, max)
) (Seq.hd s, Seq.hd s) |> Some
let (|Range|_|) (range : 'a Range) =
if range.HasData then Range (range.Minimum, range.Maximum) |> Some else None
type public FunctionSeries(?fx : float -> float) as this =
inherit Series()
[<DefaultValue>]
static val mutable public PointsProperty : DependencyProperty
static do FunctionSeries.PointsProperty <- DependencyProperty.Register("Points", typeof<PointCollection>, typeof<FunctionSeries>)
let mutable itemSource : System.Collections.IEnumerable = null
let mutable plotArea : Canvas = null
let mutable (xaxis : IAxis), (yaxis : IRangeAxis) = null, null
let mutable range = Range(-1.0, 1.0)
let mutable f = fun x -> x
let calculateItems () =
let detail = 600.0
match range with
| Seq.Range (min, max) ->
[0.0..detail]
|> List.map (fun x -> x * ((max - min) / detail) + min)
|> Seq.map (fun x -> Point(x, f x))
| _ -> Seq.empty
do
match fx with | Some fx -> f <- fx | None -> ()
itemSource <- calculateItems()
do
use stream = (Application.GetResourceStream(Uri("FunctionSeries.xaml", UriKind.RelativeOrAbsolute))).Stream
this.Style <- (XamlReader.Load(stream) :?> Style)
override this.Refresh() =
if xaxis <> null && yaxis <> null then
this.Points <-
itemSource |> Seq.of_type<Point>
|> Seq.map
(fun p ->
let x = xaxis.GetPlotAreaCoordinate(p.X).Value.Value
let y = this.ActualHeight - yaxis.GetPlotAreaCoordinate(p.Y).Value.Value
Point(x, y))
|> Seq.sortBy (fun p -> p.X)
|> (fun s -> PointCollection s)
else ()
override this.OnApplyTemplate() =
plotArea <- (this.GetTemplateChild("canvas") :?> Canvas)
this.Refresh()
override this.OnSeriesHostPropertyChanged(o, n) =
let points = itemSource |> Seq.of_type<Point>
if n <> null && Seq.isEmpty points |> not then
let first = Seq.nth 0 points
xaxis <- n.Axes
|> Seq.filter (fun a -> a.CanPlot(first.X) && a.Orientation = AxisOrientation.X)
|> Seq.nth 0
yaxis <- n.Axes
|> Seq.of_type<IRangeAxis>
|> Seq.filter (fun a -> a.CanPlot(first.Y) && a.Orientation = AxisOrientation.Y)
|> Seq.nth 0
xaxis.RegisteredListeners.Add(this)
yaxis.RegisteredListeners.Add(this)
do this.SizeChanged.Add(fun e -> this.Refresh())
member this.Range
with set value =
range <- value
itemSource <- calculateItems()
and get () = range
member this.Function
with set value =
f <- value
itemSource <- calculateItems()
and get () = f
member this.Points
with get () = this.GetValue(FunctionSeries.PointsProperty) :?> PointCollection
and set (value : PointCollection) = this.SetValue(FunctionSeries.PointsProperty, value)
interface IAxisListener with
member this.AxisInvalidated(a) = this.Refresh()
interface IRangeProvider with
member this.GetRange(consumer : IRangeConsumer ) =
if obj.ReferenceEquals(consumer, xaxis) then
let range =
itemSource
|> Seq.cast<Point>
|> Seq.map (fun p -> p.X)
|> Seq.range
match range with
| Some (min, max) -> Range<IComparable>(min, max)
| None -> Range()
else if obj.ReferenceEquals(consumer, yaxis) then
let range =
itemSource
|> Seq.cast<Point>
|> Seq.map (fun p -> p.Y)
|> Seq.range
match range with
| Some (min, max) -> Range<IComparable>(min, max)
| None -> Range()
else Range<IComparable>()
[<STAThread>]
do
let window = Window()
let app = Application()
let chart = Chart()
//parabola:
let functionSeries = FunctionSeries(fun x -> x * x)
//sine wave:
functionSeries.Function <- fun x -> Math.Sin x
functionSeries.Range <- Range(-10.0, 10.0)
//square wave:
functionSeries.Range <- Range(0.0, 50.0)
functionSeries.Function <- fun x -> [3.0..2.0..49.0] |> List.fold (fun a b -> a + Math.Sin(b * x) / b) (Math.Sin x)
window.Width <- 1050.0; window.Height <- 400.0
chart.Axes.Add(LinearAxis(Orientation = AxisOrientation.X))
chart.Axes.Add(LinearAxis(Orientation = AxisOrientation.Y))
chart.Series.Add functionSeries
window.Content <- chart
app.Run(window) |> ignore
you will also require this xaml file:
<Style
xmlns="http://schemas.microsoft.com/winfx/2006/xaml/presentation"
xmlns:x="http://schemas.microsoft.com/winfx/2006/xaml"
xmlns:local="clr-namespace:Charts;assembly=achart"
TargetType="local:FunctionSeries">
<Setter Property="Template">
<Setter.Value>
<ControlTemplate TargetType="local:FunctionSeries">
<Canvas x:Name="canvas">
<Polyline Points="{TemplateBinding Points}" Stroke="Red" StrokeThickness="1" StrokeMiterLimit="1" />
</Canvas>
</ControlTemplate>
</Setter.Value>
</Setter>
</Style>
note that you will have to replace "assembly=achart" in the xaml file with the name of your project/assembly.